Whether you're buying, selling, or investing, All City Homes is here to guide you every step of the way. Our team is committed to delivering the best service and ensuring you feel supported throughout your real estate journey.
115,396 people live in Richmond, where the median age is 37.6 and the average individual income is $41,898. Data provided by the U.S. Census Bureau.
Total Population
Median Age
Population Density Population Density This is the number of people per square mile in a neighborhood.
Average individual Income
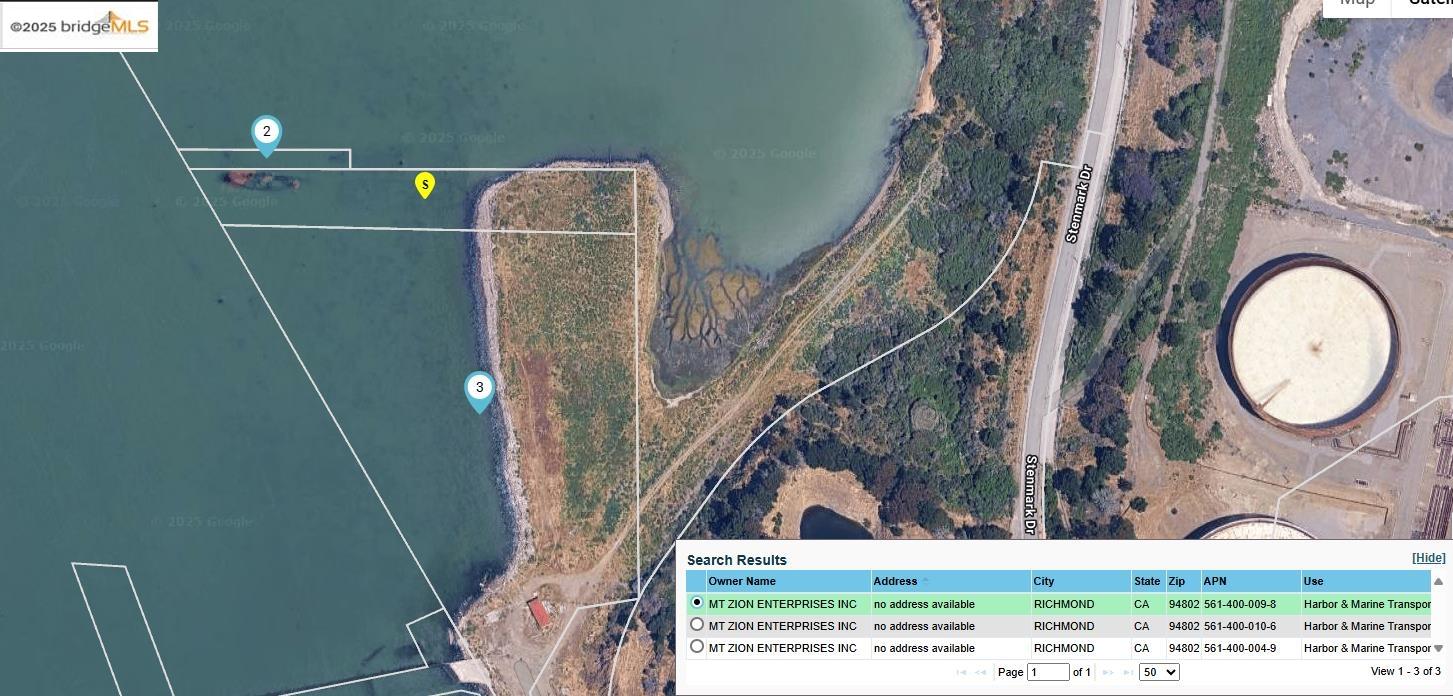
Richmond is a diverse and growing city in the East Bay, known for its rich history, scenic waterfront, and a strong sense of community. From industrial areas with a vibrant workforce to family-friendly neighborhoods with parks, Richmond offers a balance of affordability and lifestyle appeal. With easy access to BART, I-80, and the Richmond-San Rafael Bridge, it’s a convenient location for commuters while maintaining a relaxed suburban feel. All City Homes is here to guide you through Richmond's diverse real estate market, offering insights on the best neighborhoods to suit your lifestyle and budget.
Richmond has 40,466 households, with an average household size of 2.82. Data provided by the U.S. Census Bureau. Here’s what the people living in Richmond do for work — and how long it takes them to get there. Data provided by the U.S. Census Bureau. 115,396 people call Richmond home. The population density is 3,840 and the largest age group is Data provided by the U.S. Census Bureau.
Total Population
Population Density Population Density This is the number of people per square mile in a neighborhood.
Median Age
Men vs Women
Population by Age Group
0-9 Years
10-17 Years
18-24 Years
25-64 Years
65-74 Years
75+ Years
Education Level
Total Households
Average Household Size
Average individual Income
Households with Children
With Children:
Without Children:
Marital Status
Blue vs White Collar Workers
Blue Collar:
White Collar:
You’ve got questions and we can’t wait to answer them.